This tutorial is about generating better GTKWave documents (*.gtkw) from Python. The goal is to ease analysis of traces generated by unit-tests, and at the same time to better understand the inner working of modules, for which we are writing such tests.
There is a FOSDEM 2022 talk about writing GTKwave documents, with style, https://fosdem.org/2022/schedule/event/gtkwavecss/ https://video.fosdem.org/2022/D.open-hardware/gtkwavecss.webm
Stylish GTKWave Documents
In this tutorial, you will learn how to:
- Use individual trace colors.
For instance, use different color styles for input, output, debug and internal traces. - Use numeric bases besides the default hex.
- Create collapsible trace groups
Useful to hide and show, at once, groups of debug, internal and sub-module traces.
Select the opening or closing brace, then use the T key. - Add comments in the signal names pane
- Change the displayed name of a trace
- Use a sane default for initial zoom level
- Place markers on interesting places
- Put the generating file name as a comment in the file
Basic trace display
First, we need a VCD file. Try:
python -m nmutil.test.example_gtkwave
Among other files, it will generate test_shifter.vcd.
Lets write a simple GTKW document. First, import the function:
from nmutil.gtkw import write_gtkw
Create a list of the traces you want to see. Some hints:
- Put all trace names in quotes.
- Use the same names as you would see in the trace pane of GTKWave
- If a trace is multi-bit, use array notation 'name[max:min]'
For example:
traces = [
    'clk',
    # prev port
    'op__sdir', 'p_i_data[7:0]', 'p_i_shift[7:0]', 'p_i_valid', 'p_o_ready',
    # internal signals
    'fsm_state', 'count[3:0]', 'shift_reg[7:0]',
    # next port
    'n_o_data[7:0]', 'n_o_valid', 'n_i_ready'
]
Now, create the document:
write_gtkw("simple.gtkw", "test_shifter.vcd", traces, module='top.shf')
Remarks:
simple.gtkwis the name of our GTKWave documenttest_shifter.vcdis the VCD filetracesis a list of trace namestop.shfis the hierarchy path of the module
Now try:
gtkwave simple.gtkw
Notice:
- No need to press the "zoom to fit" button. The default zoom level is adequate for a 1 MHz clock.
- If you made a mistake, there will be no warning. The trace will simply not appear (the properties of the dropped trace will be given to the next signal, be careful)
- The reload button will only reload the VCD file, not the GTKW document. If you regenerate the document, you need to close and open a
new tab, or exit GTKWave and run again:
gtkwave simple.gtkw - If you feel tired of seeing the GTKWave splash window every time,
do:
echo splash_disable 1 >> ~/.gtkwaverc - If you modify the document manually, better to save it with another name
Adding color
Go back to the trace list and replace the 'op__sdir' string with:
('op__sdir', {'color': 'orange'})
Recreate the document (you can change the file name):
write_gtkw("color.gtkw", "test_shifter.vcd", traces, module='top.shf')
If you now run gtkwave color.gtkw, you will see that op__sdir
has the new color.
Writing GTKWave documents, with style
Let's say we want all input traces be orange, and all output traces be
yellow. To change them one by one, as we did with op__sdir, would be
very tedious and verbose. Also, hardcoding the color name will make it
difficult to change it later.
To solve this, lets create a style specification:
style = {
    'in': {'color': 'orange'},
    'out': {'color': 'yellow'}
}
Then, change:
('op__sdir', {'color': 'orange'})
to:
('op__sdir', 'in')
then (notice how we add style):
write_gtkw("style1.gtkw", "test_shifter.vcd", traces, style, module='top.shf')
If you now run gtkwave style1.gtkw, you will see that op__sdir
still has the new color.
Let's add more color:
traces = [
    'clk',
    # prev port
    ('op__sdir', 'in'),
    ('p_i_data[7:0]', 'in'),
    ('p_i_shift[7:0]', 'in'),
    ('p_i_valid', 'in'),
    ('p_o_ready', 'out'),
    # internal signals
    'fsm_state',
    'count[3:0]',
    'shift_reg[7:0]',
    # next port
    ('n_o_data[7:0]', 'out'),
    ('n_o_valid', 'out'),
    ('n_i_ready', 'in'),
]
Then
write_gtkw("style2.gtkw", "test_shifter.vcd", traces, style, module='top.shf')
If you now run gtkwave style2.gtkw, you will see that input, output and internal signals have different color.
New signals at simulation time
At simulation time, you can declare a new signal, and use it inside the test case, as any other signal. By including it in the "traces" parameter of Simulator.write_vcd, it is included in the trace dump file.
Useful for adding "printf" style debugging for GTKWave.
String traces
When declaring a Signal, you can pass a custom decoder that translates the Signal logic level to a string. nMigen uses this internally to display Enum traces, but it is available for general use.
Some applications are:
- Display a string when a signal is at high level, otherwise show a single horizontal line. Useful to draw attention to a time interval.
- Display the stages of a unit test
- Display arbitrary debug statements along the timeline.
from the documentation for Signal:
    decoder : function or Enum
        A function converting integer signal values to human-readable
        strings (e.g. FSM state names). If an ``Enum`` subclass is
        passed, it is concisely decoded using format string
        ``"{0.name:}/{0.value:}"``, or a number if the signal value
        is not a member of the enumeration.
262 # demonstrates adding extra debug signal traces
263 # they end up in the top module
264 #
265 zero = Signal() # mark an interesting place
266 #
267 # demonstrates string traces
268 #
269 # display a message when the signal is high
270 # the low level is just an horizontal line
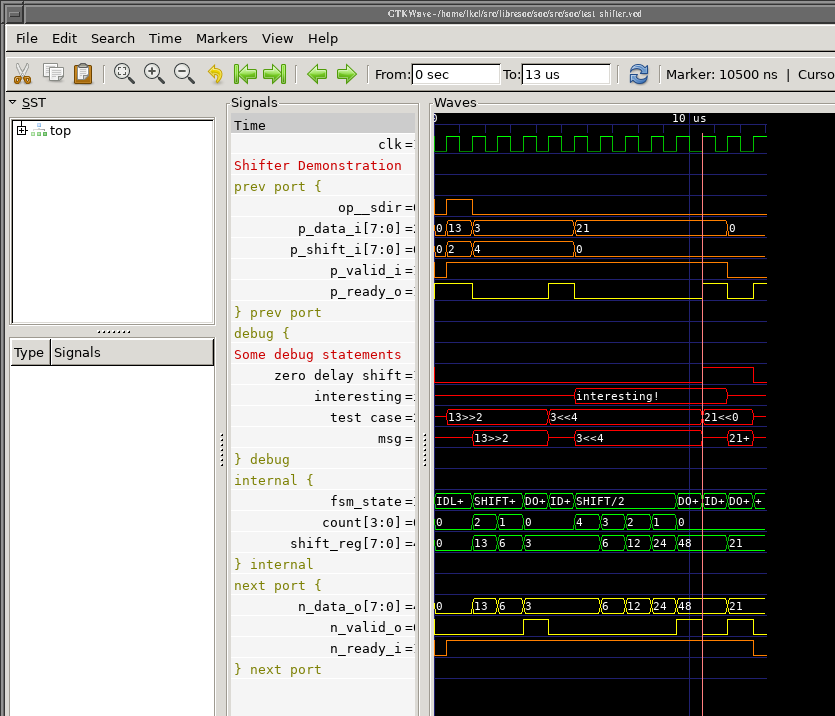
271 interesting = Signal(decoder=lambda v: 'interesting!' if v else '')
272 # choose between alternate strings based on numerical value
273 test_cases = ['', '13>>2', '3<<4', '21<<0']
274 test_case = Signal(8, decoder=lambda v: test_cases[v])
275 # hack to display arbitrary strings, like debug statements
276 msg = Signal(decoder=lambda _: msg.str)
277 msg.str = ''
Then, in the Simulation, an arbitrary debug message can be inserted at exactly the right required point. remember to "waggle" the Signal itself so that the Simulation knows to put the change of the string into the VCD file:
 289         # show current operation operation
 290         if direction:
 291             msg.str = f'{data}>>{shift}'
 292         else:
 293             msg.str = f'{data}<<{shift}'
 294         # force dump of the above message by toggling the
 295         # underlying signal
 296         yield msg.eq(0)
 297         yield msg.eq(1)
Also very important is to explicitly add the debug Signal to the gtkwave list of Signals to watch for. As the debug Signal is at the top-level, without them being explicitly added they will be removed from the vcd file.
 352     sim.add_sync_process(producer)
 353     sim.add_sync_process(consumer)
 354     sim_writer = sim.write_vcd(
 355         "test_shifter.vcd",
 356         # include additional signals in the trace dump
 357         traces=[zero, interesting, test_case, msg],
 358     )
 359     with sim_writer:
 360         sim.run()
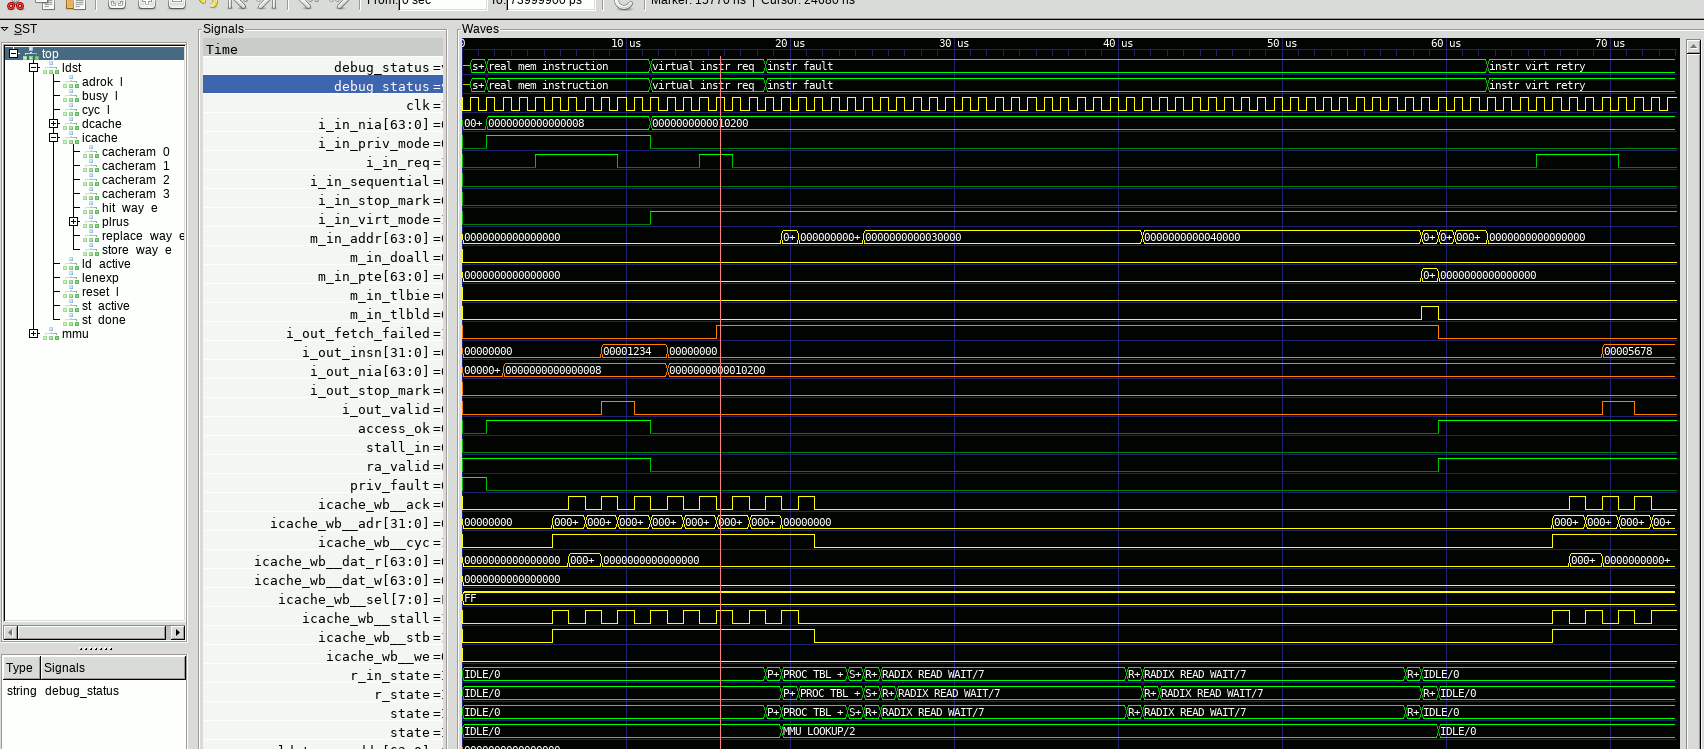
Here is an actual practical use where a "debug_status" message has been added (and toggled) to show the different phases as a unit test progresses. This unit test (MMU Virtual Memory Page-Table fault, and PTE insertion into the I-Cache) is particularly complex and so is a three-stage process that needed some context in order to see which phase of the test is underway.